This graph was first compiled as the central illustration of Harrison’s 2019 book The Glasgow Effect: A Tale of Class, Capitalism & Carbon Footprint to illustrate the artist’s increasing amount of travel in the years running up to her 2016 project and the dramatic impact it had on reducing her carbon footprint for transport. It was updated in 2020 for display at Edinburgh Art Festival.

Harrison first compiled the ‘Carbon Graph’ over the course of a month (in April and May 2019) while she was writing her book by calculating the distance of all 3,628 journeys she made in motorised vehicles since registering as a self-employed ‘professional artist’ in 2004 (journeys on foot or by bike were excluded as they have zero carbon footprint).
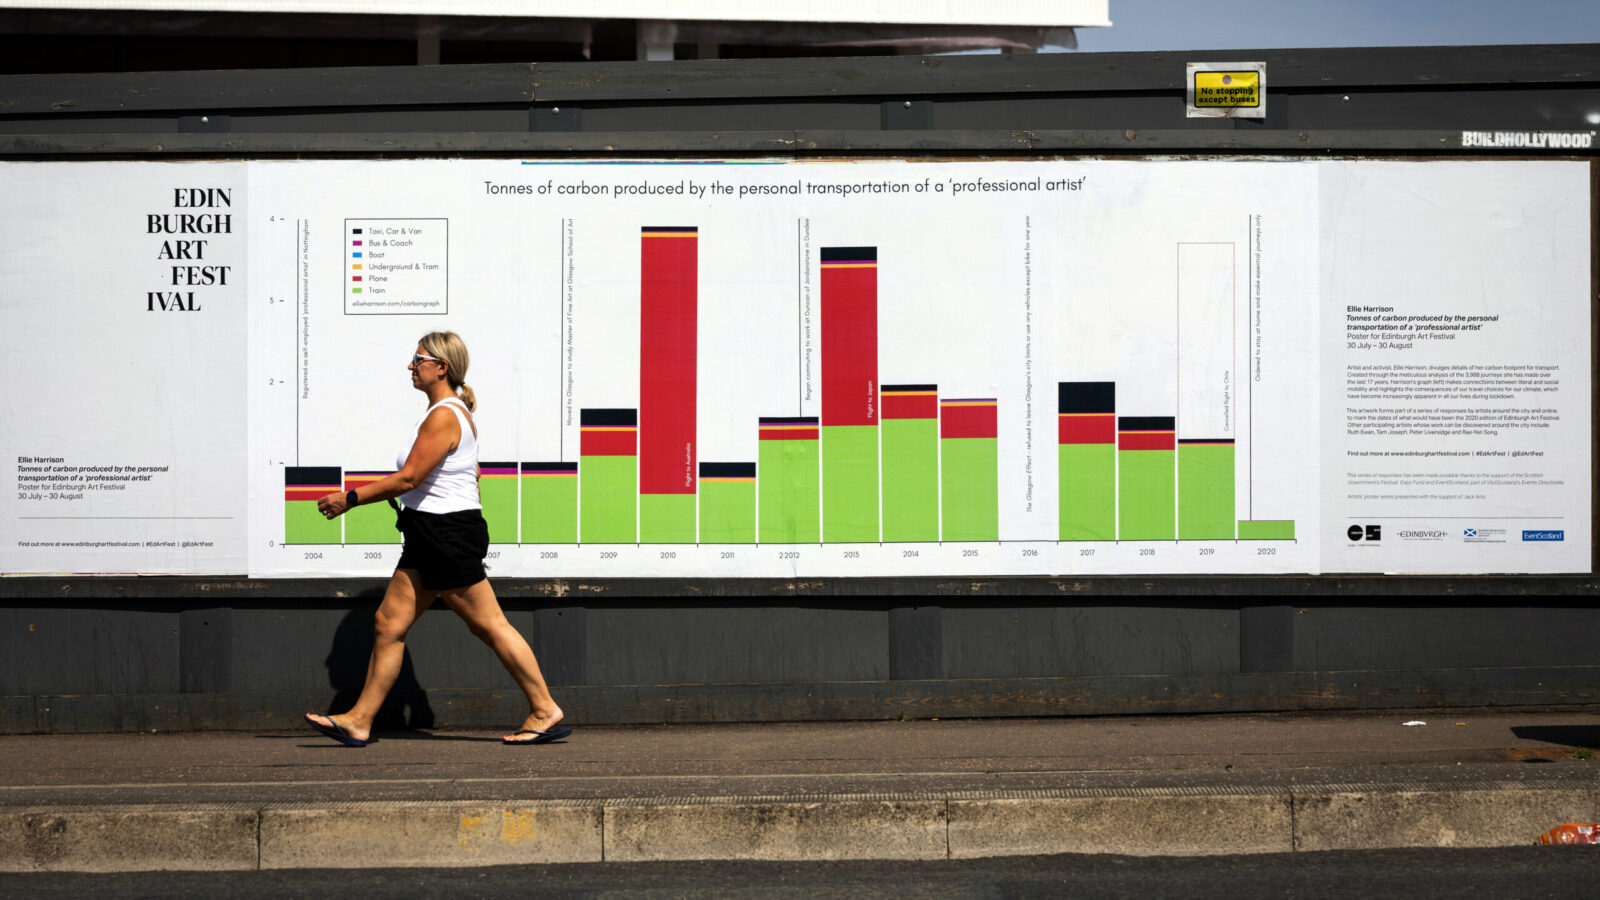
The graph was then updated in July 2020 to show the impact of the coronavirus lockdown on her carbon footprint for transport, and exhibited on two billboard sites in Edinburgh for the Edinburgh Art Festival (30 July – 30 August 2020). As of 30 July 2020, she had made 3,988 journeys in motorised vehicles over the last 17 years.
To identify these journeys, Harrison reviewed all her records of ‘travel expenses’ in parallel with old diaries and photographs, and then used the websites below to calculate the distance in kilometres of each:
- Rail Miles Engine for all UK train journeys
- Google Maps for all international train journeys, bus, car and all other land and sea transport
- MapCrow Distance Calculator between Cities for all plane journeys.
Harrison then multiplied the total annual distance for each transportation mode (Table 1) by the most up-to-date Conversion Factors (Table 2), issued by the UK Government’s Department for Business, Energy & Industrial Strategy in July 2018. The kg CO2e (kilograms of carbon dioxide equivalent) Conversion Factors take into account the impact of the seven main greenhouse gases that contribute to climate change, as defined by the Kyoto Protocol. The greenhouse gases are:
- carbon dioxide (CO2)
- methane (CH4)
- nitrous oxide (N2O)
- hydrofluorocarbons (HFCS)
- perfluorocarbons (PFCS)
- sulfur hexafluoride (SF6)
- nitrogen trifluoride (NF3)
Table 1: Annual distances for each transportation mode (km)
| 2004 | 2005 | 2006 | 2007 | 2008 | 2009 | 2010 | 2011 | |
| Taxi, Car & Van | 1,261 | 174 | 916 | 420 | 481 | 1,045 | 313 | 921 |
| Bus & Coach | 743 | 669 | 668 | 2,811 | 1,099 | 596 | 602 | 143 |
| Boat | 0 | 67 | 446 | 13 | 0 | 4 | 8 | 46 |
| Underground & Tram | 1,167 | 1,542 | 835 | 1,142 | 992 | 1,174 | 1,368 | 1,312 |
| Plane | 1,441 | 2,478 | 664 | 0 | 0 | 3,290 | 36,877 | 0 |
| Train | 12,120 | 12,913 | 18,913 | 18,236 | 18,545 | 24,434 | 13,758 | 17,149 |
| Total | 16,731 | 17,843 | 22,441 | 22,622 | 21,117 | 30,543 | 52,926 | 19,570 |
| 2012 | 2013 | 2014 | 2015 | 2016 | 2017 | 2018 | 2019 | |
| Taxi, Car & Van | 388 | 940 | 405 | 50 | 0 | 2,122 | 924 | 242 |
| Bus & Coach | 553 | 936 | 161 | 201 | 0 | 258 | 439 | 165 |
| Boat | 107 | 102 | 0 | 120 | 0 | 0 | 0 | 15 |
| Underground & Tram | 1,124 | 1,102 | 1,175 | 1,272 | 0 | 684 | 661 | 656 |
| Plane | 1,528 | 22,692 | 3,435 | 4,715 | 0 | 4,090 | 2,453 | 0 |
| Train | 28,881 | 32,623 | 34,368 | 28,790 | 0 | 26,975 | 25,156 | 26,231 |
| Total | 32,581 | 58,395 | 39,544 | 35,147 | 00,000 | 34,129 | 29,633 | 27,309 |
Table 2: Conversion Factors
| Transportation mode | Conversion Factor kg CO2e | with Radiative Forcing (RF)* |
| Ferry (average) | 0.11287 | |
| Coach | 0.02801 | |
| Local bus (average) | 0.10097 | |
| Domestic flight (average) | 0.15780 | 0.29832 |
| Short-haul flight (economy) | 0.08440 | 0.15970 |
| Long-haul flight (economy) | 0.08610 | 0.16279 |
| Black cab | 0.21420 | |
| Car (average) | 0.17753 | |
| National rail | 0.04424 | |
| London Underground | 0.03760 | |
| Light rail and tram | 0.03967 |
* Radiative Forcing (RF) is a measure of the additional environmental impact of aviation caused by emitting nitrous oxide and water vapour at high altitude. The Conversion Factors without RF were used for the Carbon Graph so it is still possible to see clear definition in the other modes of transport.↩