Installations
-
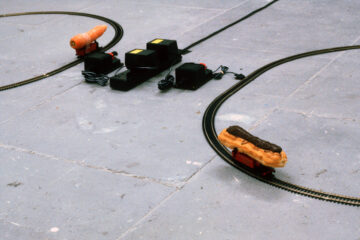
Kinetic Cake vs Kinetic Carrot
A kinetic installation created by Harrison in December 2000 whilst studying at Nottingham Trent University. As a precursor to Potential Generator, this installation visualises the energy content of a carrot and a chocolate éclair, by racing them around two facing train tracks at equivalent speeds – the éclair being just over three times faster than the vegetable of a comparable size.
-

Superfluous Consumption
Harrison’s first interactive installation (created in December 2000 whilst studying at Nottingham Trent University) draws an analogy between the unnecessary energy we consume in snack foods and that consumed by the electrical appliances we use for entertainment and comfort in our homes. The viewer is invited into an arm chair to watch various snack foods appear on a TV screen for durations equivalent to their energy content.